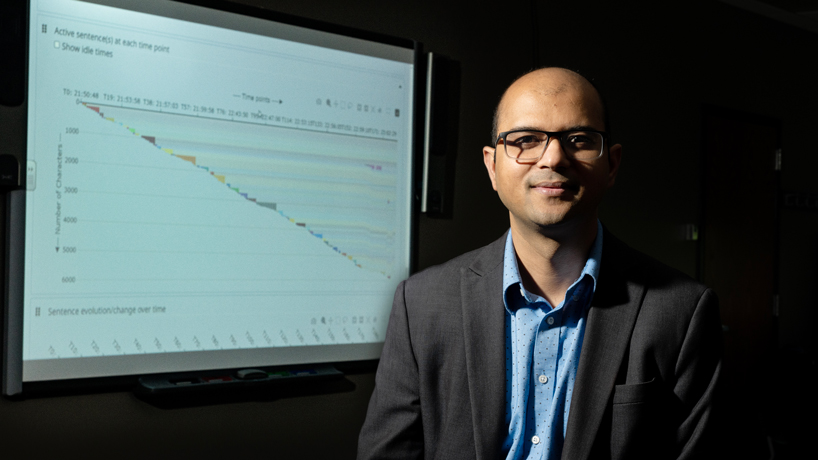
Process Feedback provides users analysis in charts and graphs to help them better visualize and understand the process they use to produce their work.

Process Feedback provides users analysis in charts and graphs to help them better visualize and understand the process they use to produce their work.
Process Feedback provides users analysis in charts and graphs to help them better visualize and understand the process they use to produce their work.
Process Feedback provides users analysis in charts and graphs to help them better visualize and understand the process they use to produce their work.
Mendez has been accepted into a master’s program at Washington University after finishing her bachelor’s degree in 3 1/2 years.