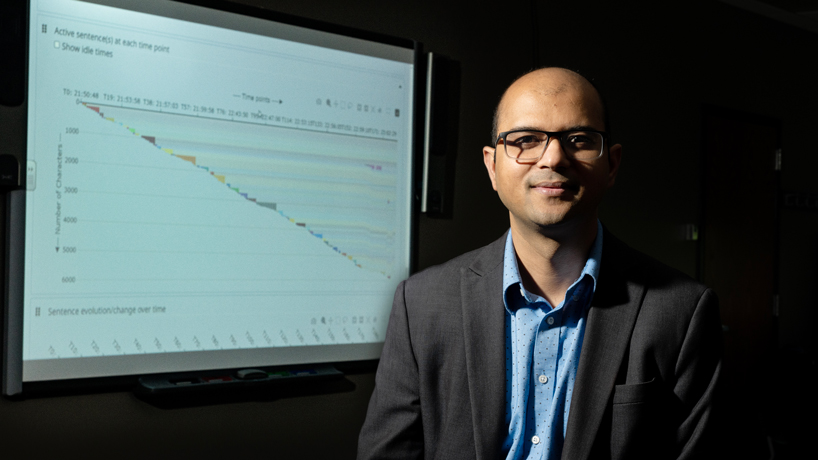
Process Feedback provides users analysis in charts and graphs to help them better visualize and understand the process they use to produce their work.

Process Feedback provides users analysis in charts and graphs to help them better visualize and understand the process they use to produce their work.
Process Feedback provides users analysis in charts and graphs to help them better visualize and understand the process they use to produce their work.
Process Feedback provides users analysis in charts and graphs to help them better visualize and understand the process they use to produce their work.
A storm system visited the UMSL campus last week and left a stunning visual.