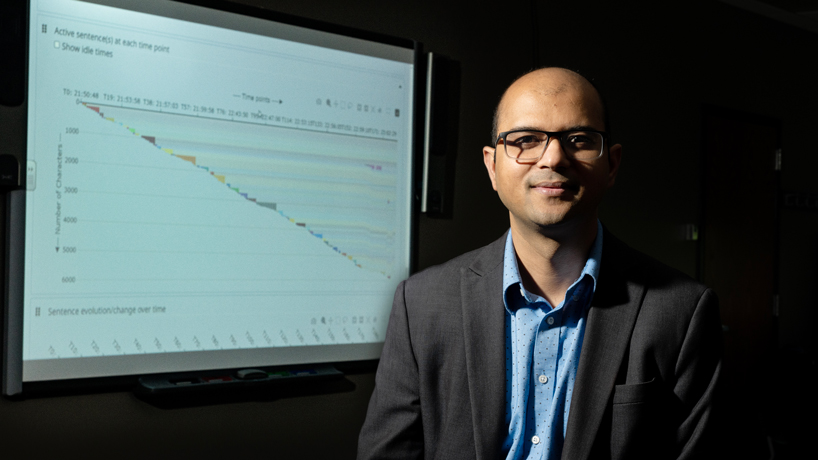
Process Feedback provides users analysis in charts and graphs to help them better visualize and understand the process they use to produce their work.

Process Feedback provides users analysis in charts and graphs to help them better visualize and understand the process they use to produce their work.
Process Feedback provides users analysis in charts and graphs to help them better visualize and understand the process they use to produce their work.
Process Feedback provides users analysis in charts and graphs to help them better visualize and understand the process they use to produce their work.
Nichols is investigating proteins linked to inflammation in the brain that occurs as part of the neurodegenerative disease.