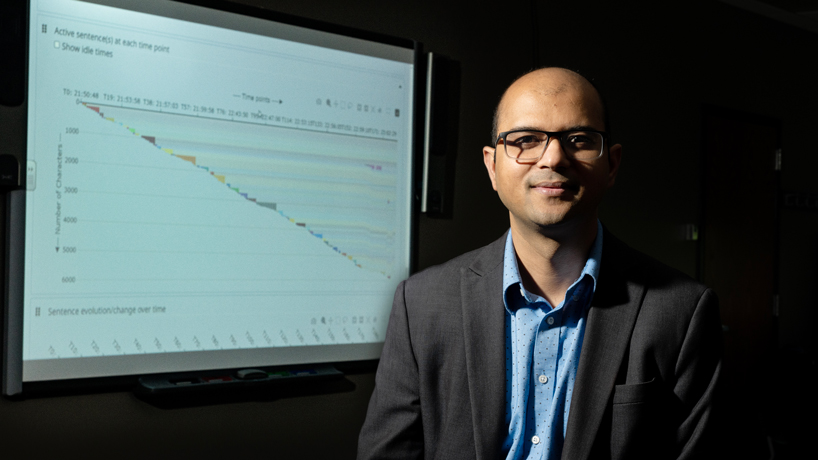
Process Feedback provides users analysis in charts and graphs to help them better visualize and understand the process they use to produce their work.

Process Feedback provides users analysis in charts and graphs to help them better visualize and understand the process they use to produce their work.
Process Feedback provides users analysis in charts and graphs to help them better visualize and understand the process they use to produce their work.
Process Feedback provides users analysis in charts and graphs to help them better visualize and understand the process they use to produce their work.
Perry earned his degree with an emphasis in information systems and technology and received an Outstanding Student Award from the Ed G. Smith College of Business.